Industrial energy metering · Argentina

Cut your plant's electricity cost with your own measurements, not with estimates.

We instrument your plant's switchboards, integrate the measurements into a cloud platform and turn them into decisions: eliminating power factor penalties, adjusting contracted demand and controlling consumption per unit produced.

V · A
Voltage and current, per phase
kW · kVAr · kVA
Active, reactive and apparent power
cos φ
Power factor
THD %
Harmonic distortion and individual harmonics
kWh · kVArh
Cumulative energy, imported and exported
Hz
Grid frequency
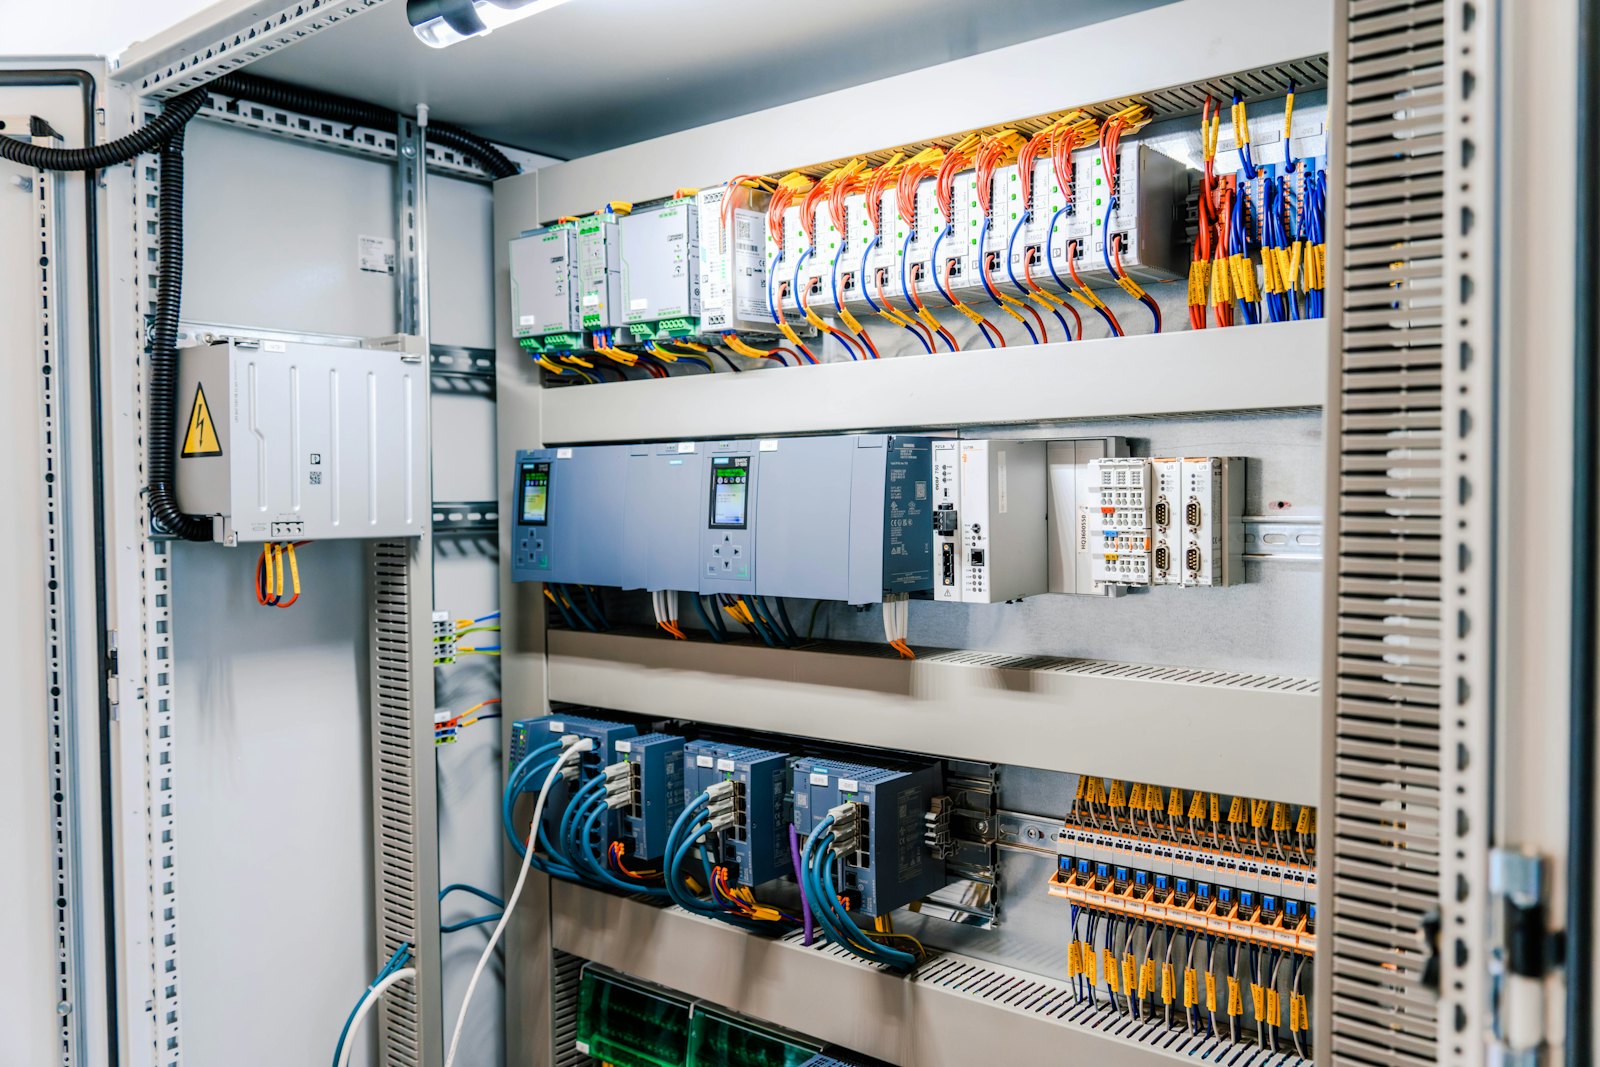
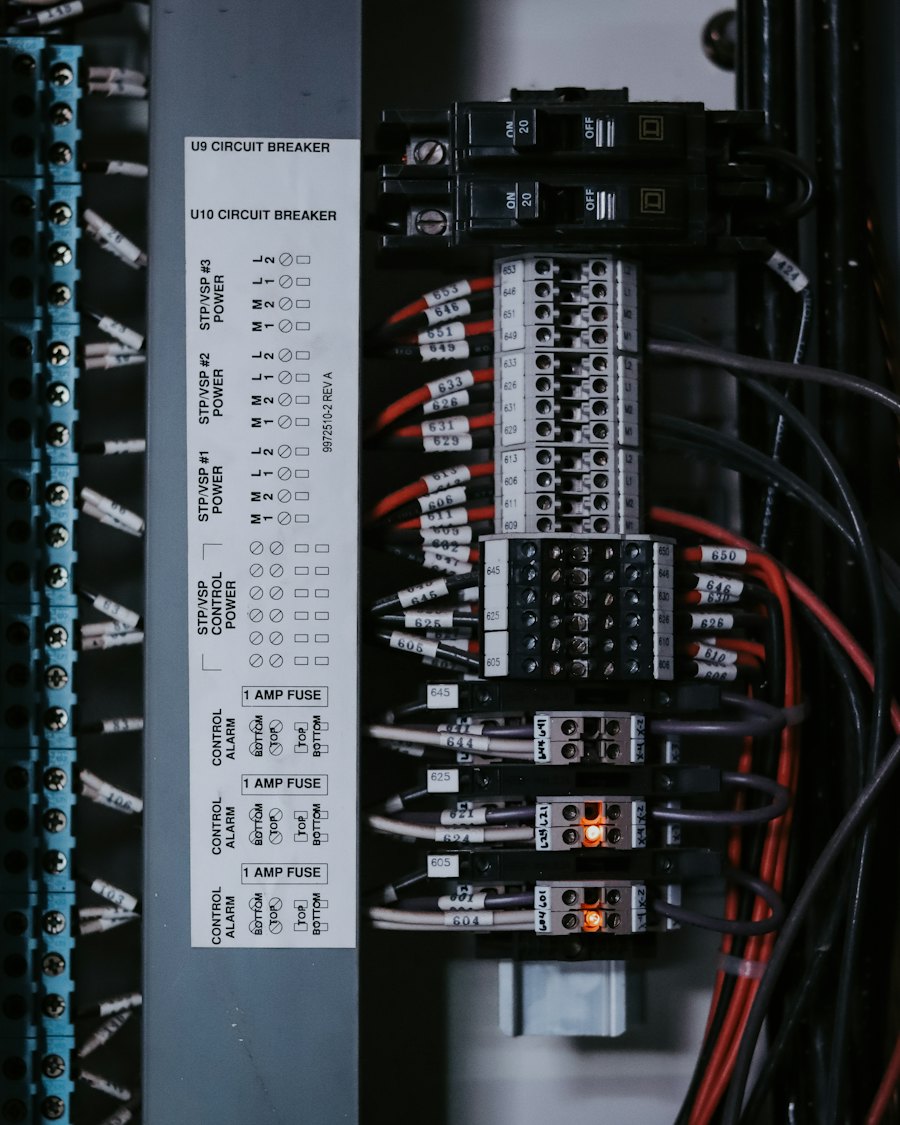
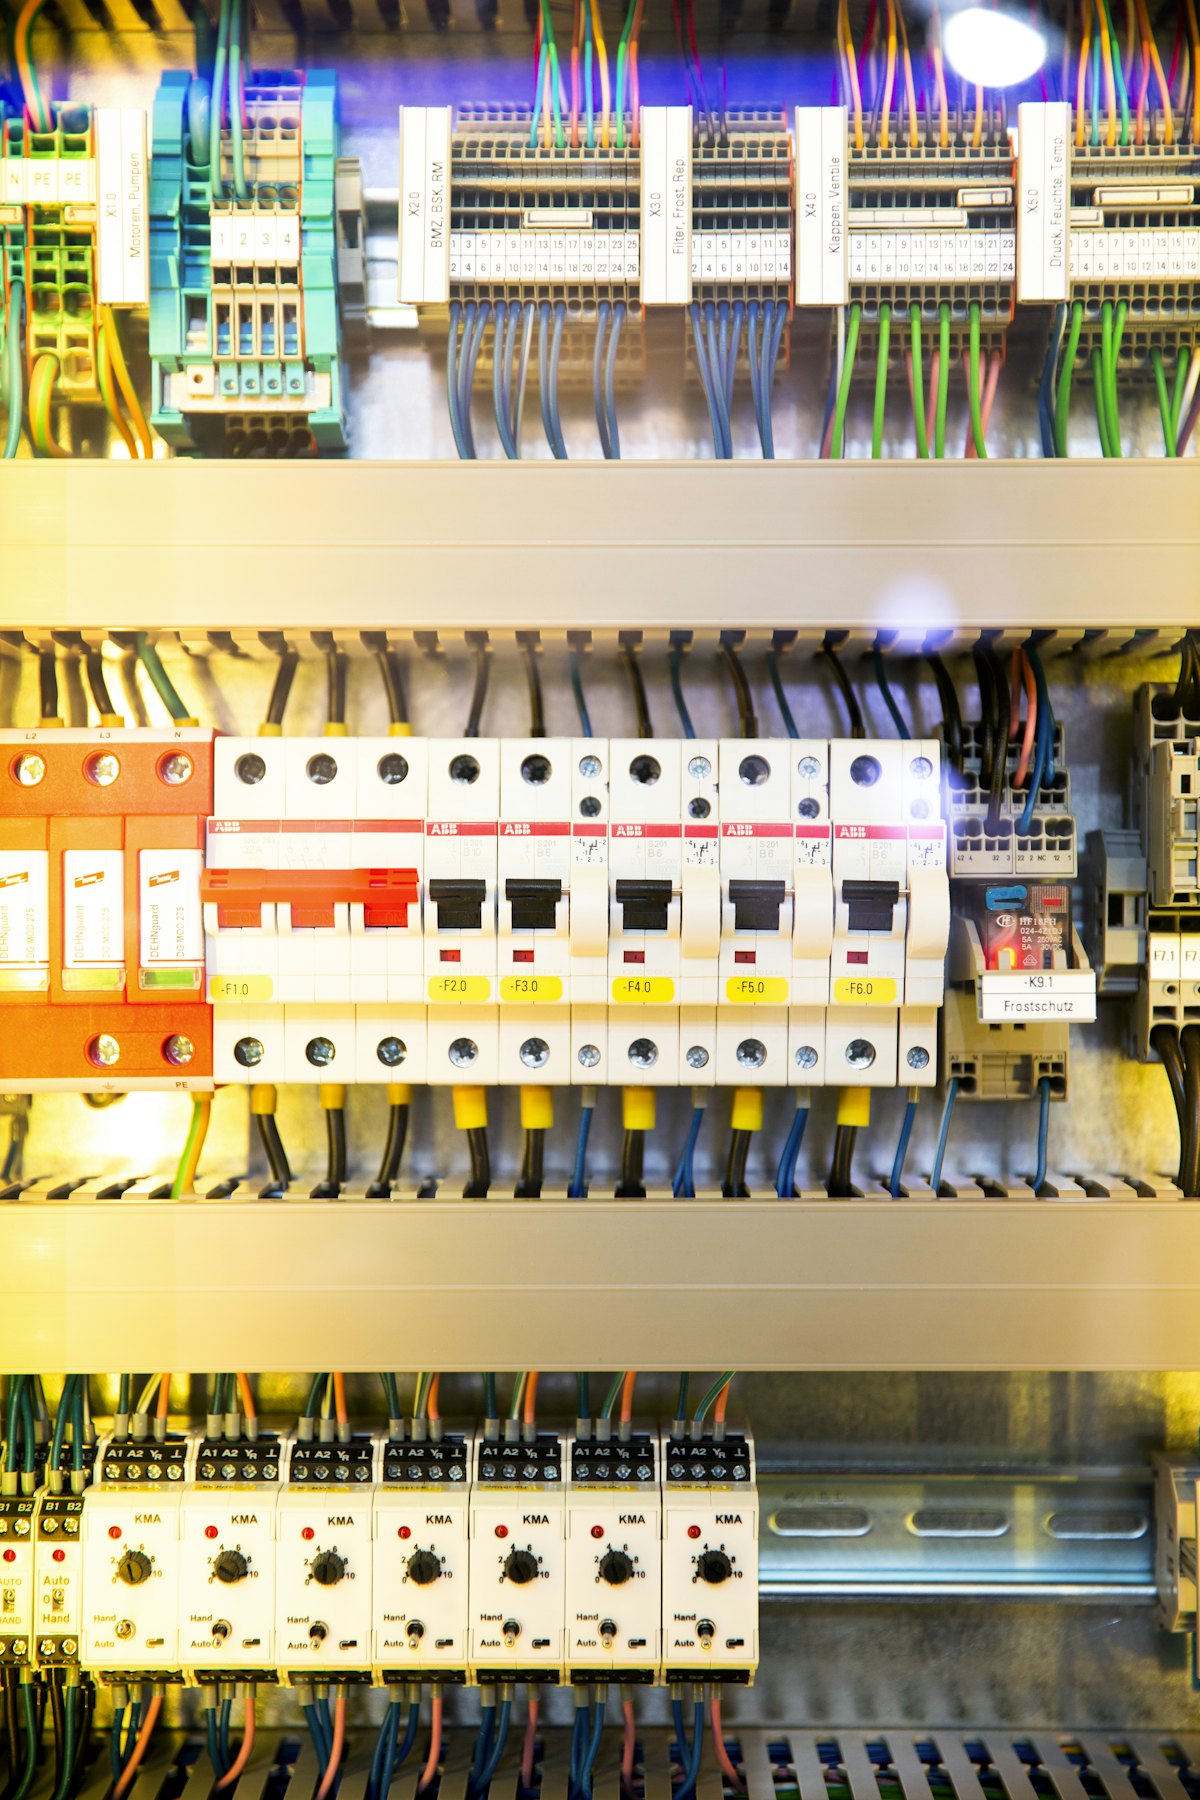
Industrial electrical switchboard with breakers and wiring
Main switchboard · split-core CTs up to 400 A

Service 1 · Instrumentation

Three-phase metering at the switchboard, with no supply interruption.

Installation is carried out with split-core current transformers on the existing conductors, at the main switchboard or in the area to be surveyed. It is performed by a licensed electrician, either the plant's own or one we arrange.

  • Real-time readings: the three phases and the neutral recorded every few seconds.
  • Power quality included: power factor, harmonic distortion and individual harmonics, in addition to consumption.
  • Cloud-connected over Ethernet or Wi-Fi, with end-to-end encryption and a dedicated certificate for each device.
  • Self-updating: firmware is updated remotely and, if the new version fails to connect, the device automatically reverts to the previous one.
  • Data separated by company: each organization signs in with its own credentials to its own space, with its devices, its history and its comparisons.
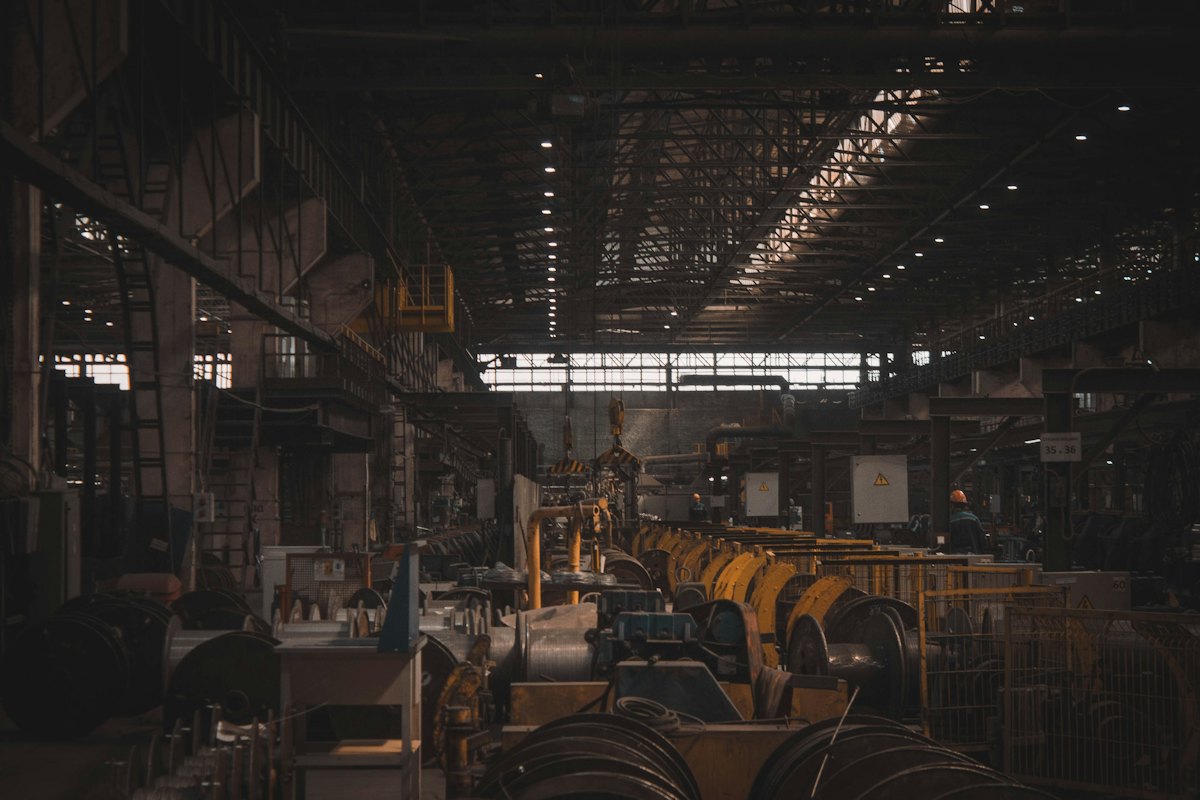
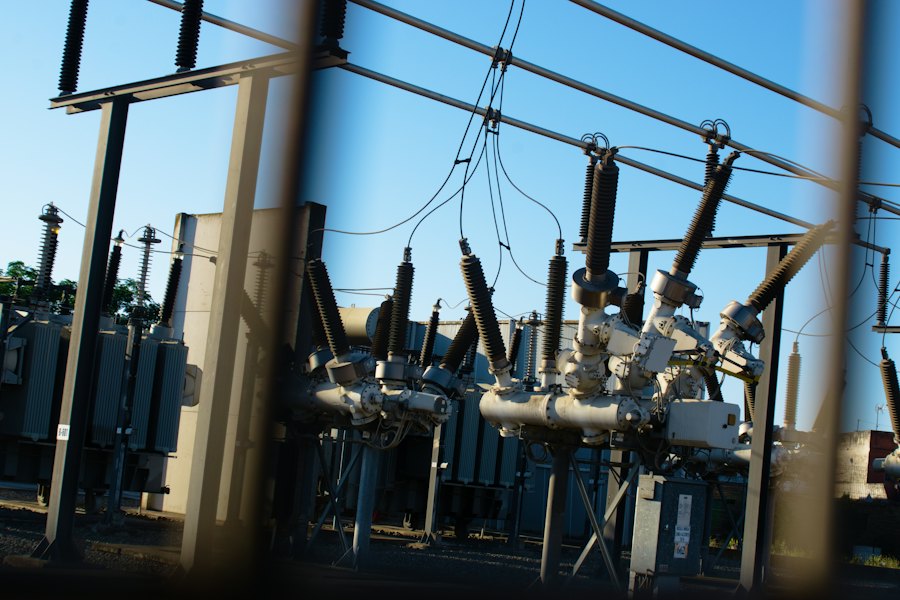
Industrial plant with machinery in operation
Specific consumption · kWh per unit produced

Service 2 · Efficiency consulting

Diagnosis based on data measured at your plant.

An electricity bill contains avoidable charges and reducible charges. We identify them with our own measurements and deliver a reduction plan stating the payback of each action.

  • Baseline: how much the plant consumes, at what time and in which area.
  • Bill analysis: contracted demand against actual demand, power factor charges and tariff classification.
  • Specific consumption: kWh per unit produced, to identify which shift, line or product performs below the average.
  • Habits and deviations: equipment left running outside production hours, off-schedule start-ups and loads that vary with no identified cause.
  • Improvement plan with payback: order of priority, estimated investment and payback period for each measure.
  • Carbon footprint calculated with a methodology aligned to ISO 50001, ready to report.
25%over three years

The first 16 industrial plants that implemented an energy management system under ISO 50001 improved their performance by between 6% and more than 25% over three years, and nine manufacturing plants achieved 10% within the first 18 months, with payback in under two years. These are figures from the United States Department of Energy, not ours: those plants certified the complete system, with external audit.

Method

From the site survey to the reduction plan, in five stages.

  1. Site survey

    Technical visit to the plant: switchboard, bill and production process. The points to be instrumented are defined jointly.

  2. Installation

    Pre-wired enclosure and current transformers on the existing conductors, with no supply interruption. Readings verified on site.

  3. Data in the cloud

    Consumption is available in the portal from the first measurement. The history accumulates and consolidates the baseline.

  4. Report and plan

    Diagnostic report with the inefficiencies detected, the corrective measures and the payback of each one.

  5. Follow-up

    The instrumentation remains in service. The measures are verified to deliver as expected and deviations are reported.

The portal

Your facilities, online, from any device.

Each client signs in with their credentials at meter.archibliss.com and reviews their consumption dashboards, power quality and history. Each organization has access only to its own devices.

Log in to the portal
  • LIVEPower per phase, power factor and overall supply status, updated within seconds.
  • HISTORYConsumption by hour, day and month. Load profile to identify demand peaks and the shifts with the highest cost.
  • QUALITYHarmonic distortion and harmonics per phase, to tell supply problems apart from installation problems.
  • TARIFFThe tariff schedules loaded and verified one by one against Argentina's official gazette, to go from kWh to pesos.

Energy cost reduction

Where the avoidable cost is concentrated.

Three items a plant pays too much for without noticing, and that metering brings into view.

Contact

Request a site survey.

With the latest electricity bill and a photograph of the main switchboard we can indicate whether instrumenting the plant is warranted and where it is best to begin.

Contact
info@archibliss.com
What's new
news.archibliss.com
Coverage
Ask about your location.